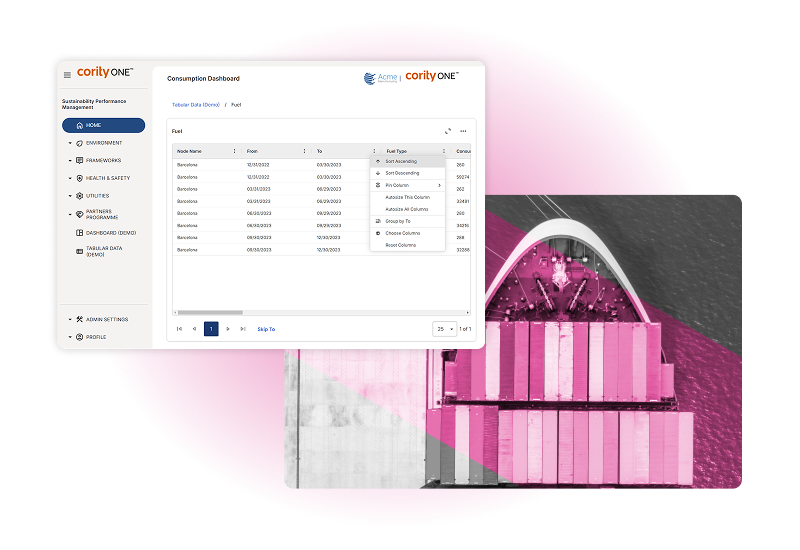


Centralize sustainability data
Automate ESG reporting
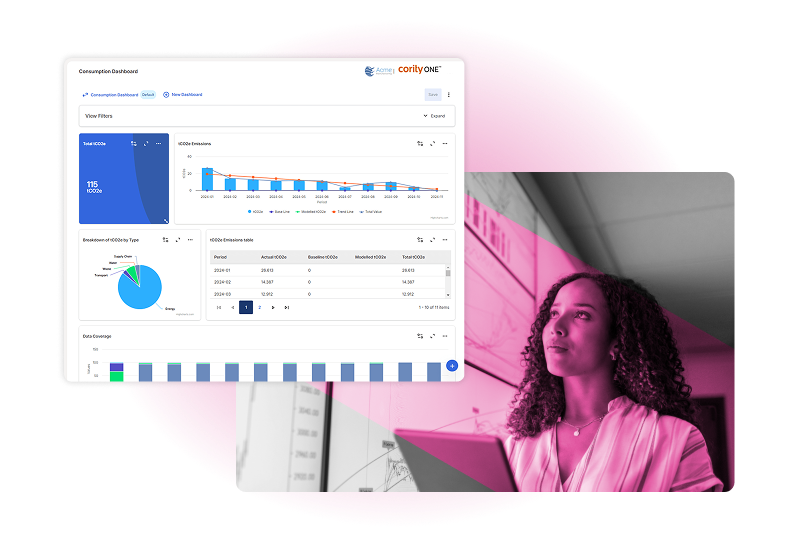
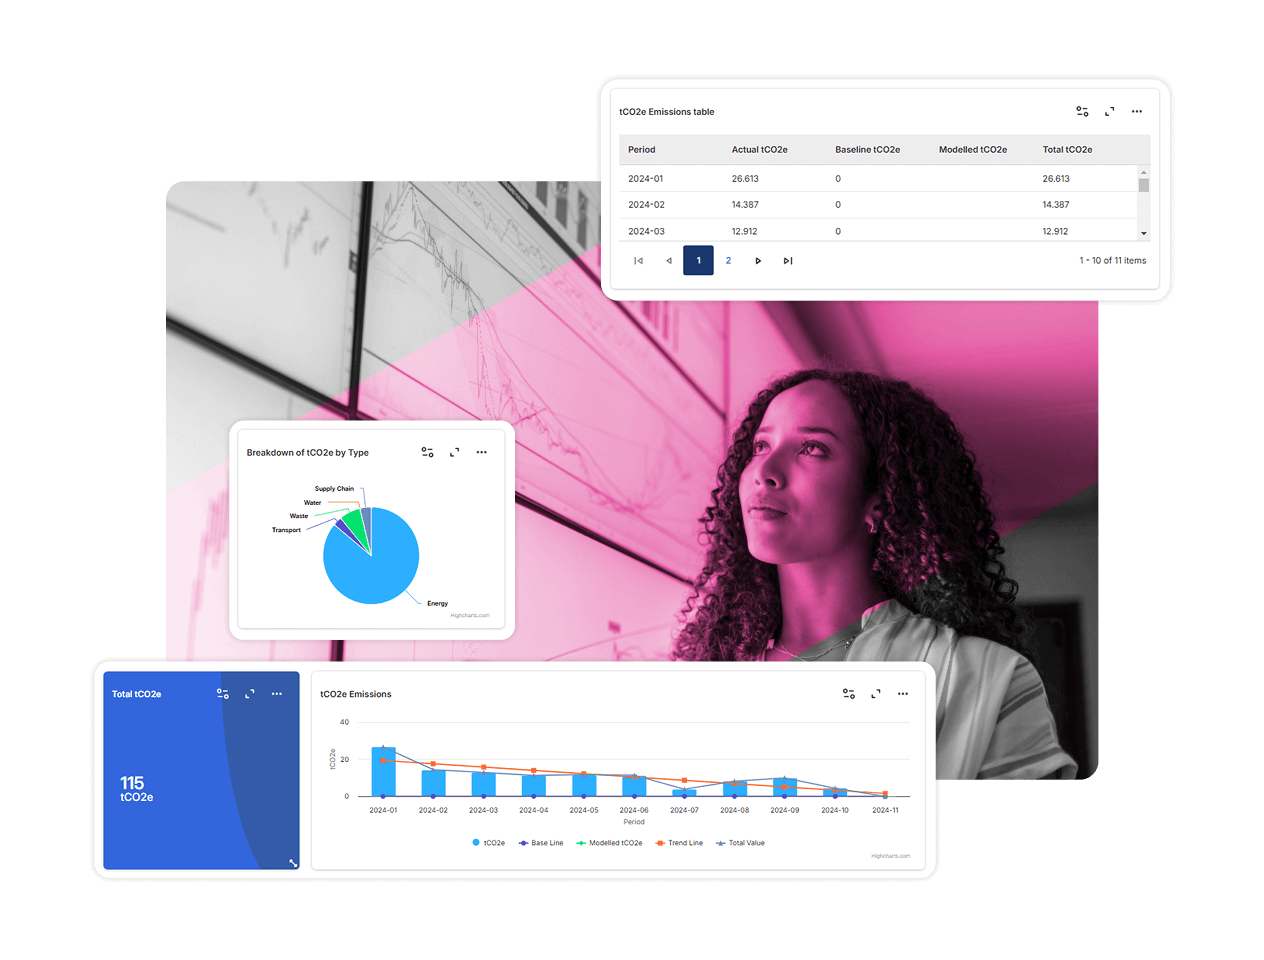
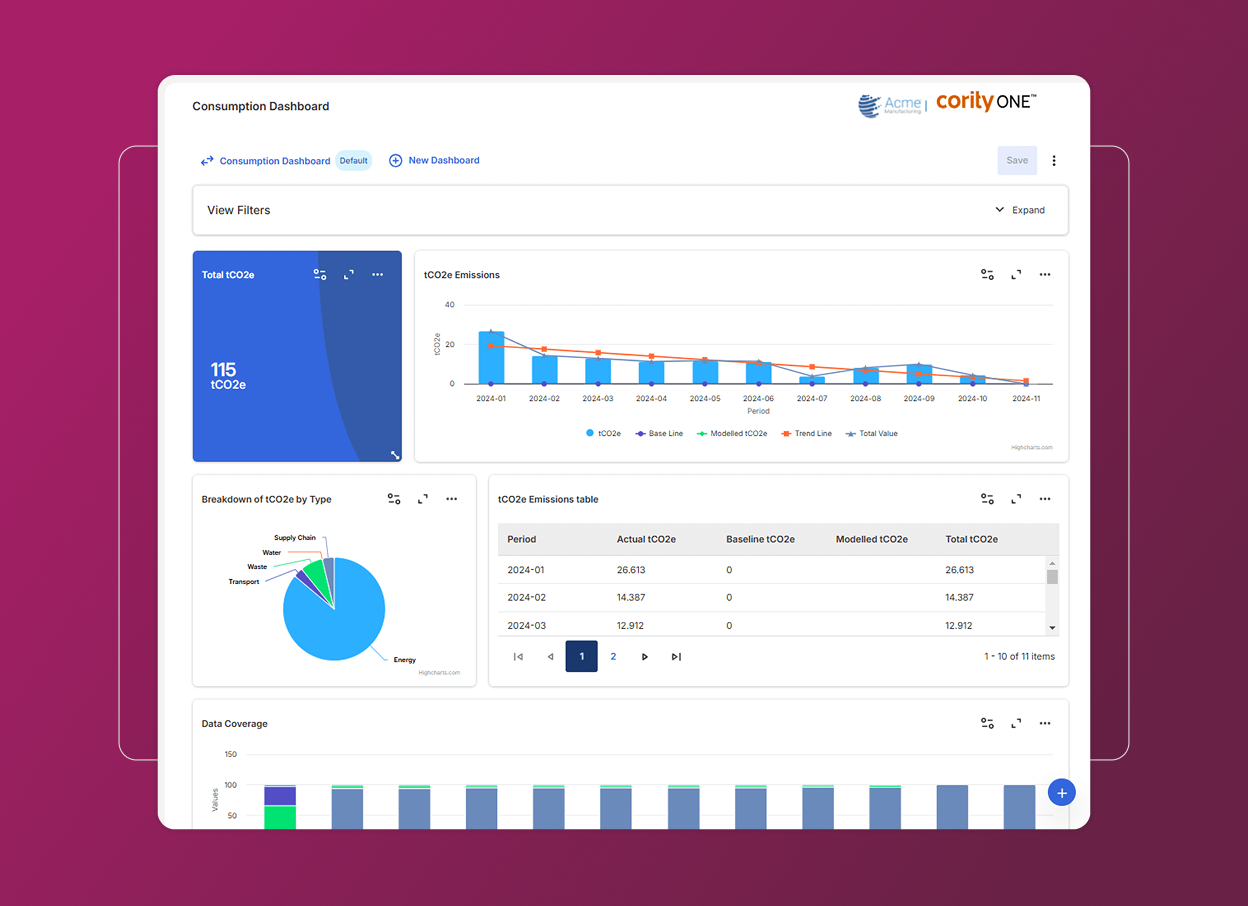
Gain actionable insights

Improve stakeholder trust

Centralized supplier data management

Increase supplier engagement

Monitor supply chain risk

Get a full view

Collect investor-grade ESG data

Track portfolio trends

Align with frameworks

Improve ESG scoring

Automate GHG emissions tracking

Ensure compliance
Track carbon footprint
Simplify reporting

End-to-end advisory support

Sector-specific insights

Tailored offerings for customers

Advising through complexity