
Private Markets ESG
ESG Solutions for Private Markets to Power Smarter Decisions
Unlock powerful ESG insights across portfolios to improve reporting, reduce risk, and drive long‑term value.
Built to securely report to global ESG data standards & frameworks.
ESG Solution Benefits for Investors
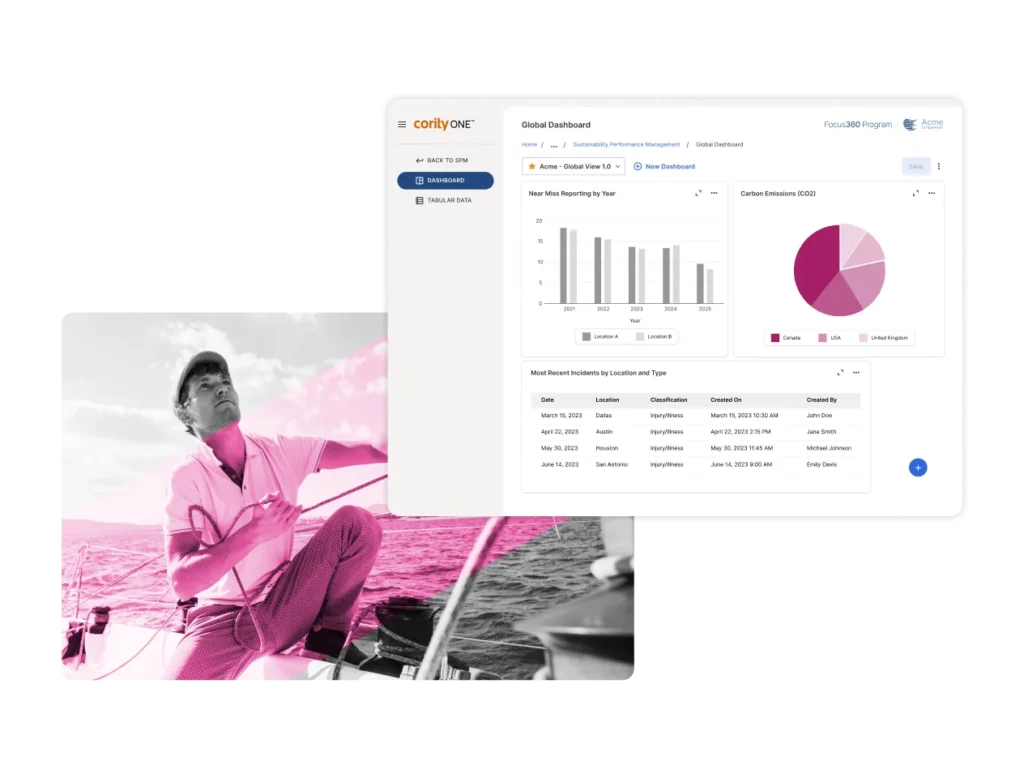
Stronger, Data-Led Decisions
Combine ESG & operational data for clear insight into portfolio risks and opportunities.
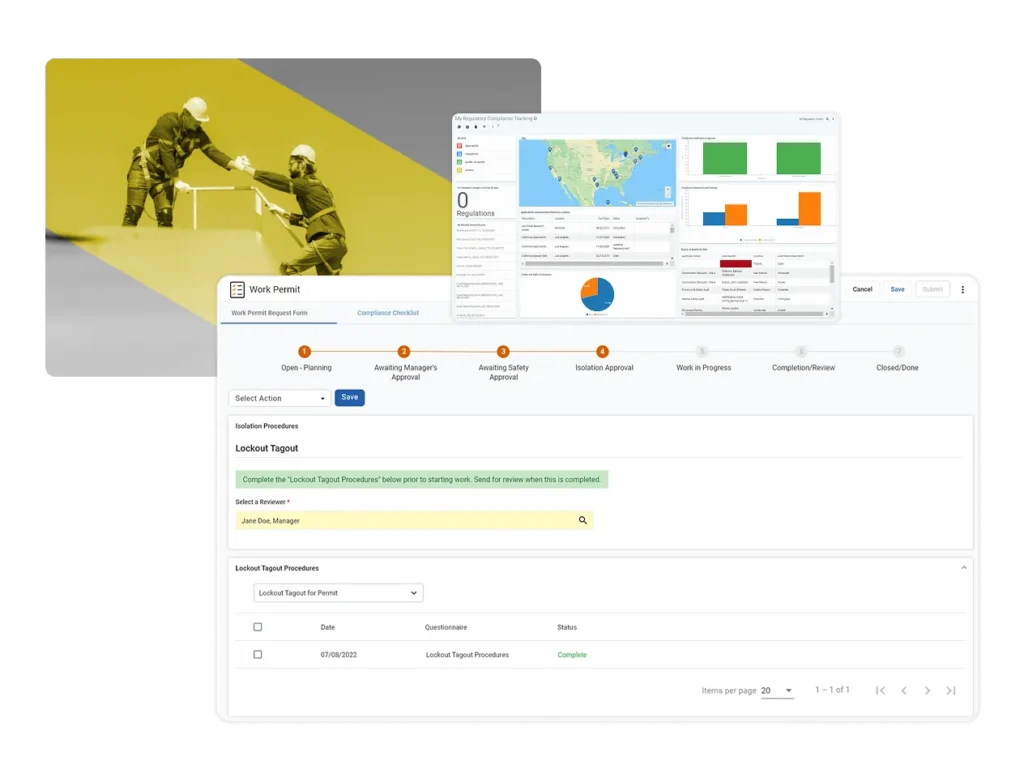
Simplified ESG Compliance
Deliver accurate ESG disclosures aligned to PCAF, UN PRI, EDCI, SFDR, and CSRD.
Smarter Risk Management
Spot ESG-linked risks early to protect value.
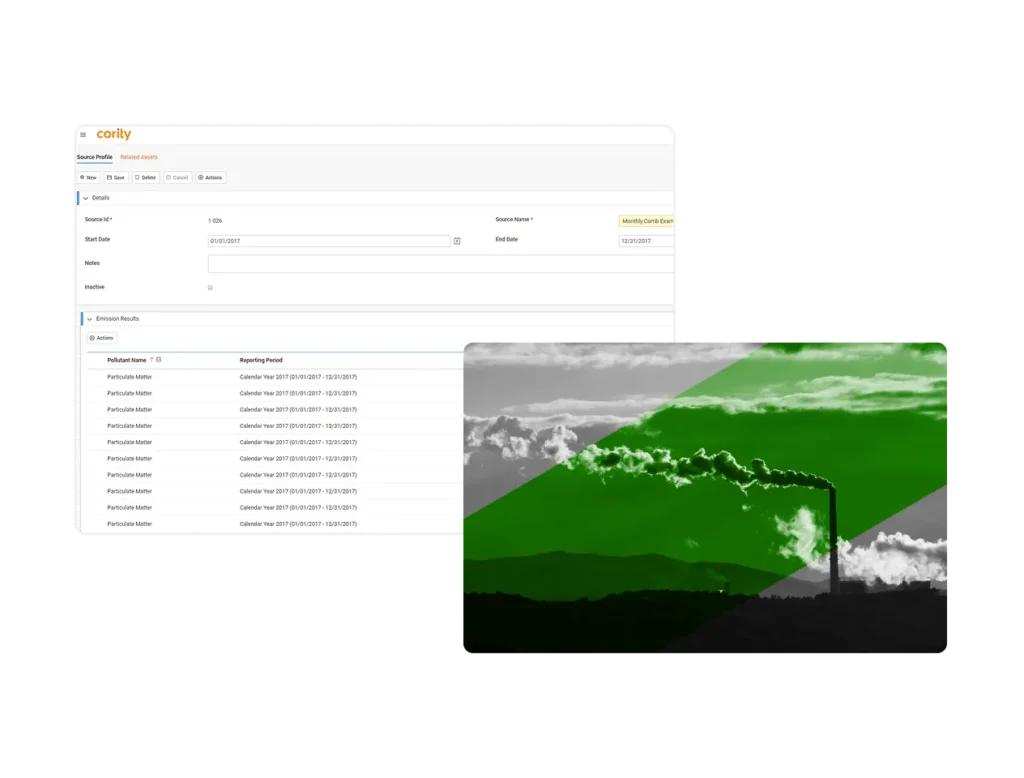
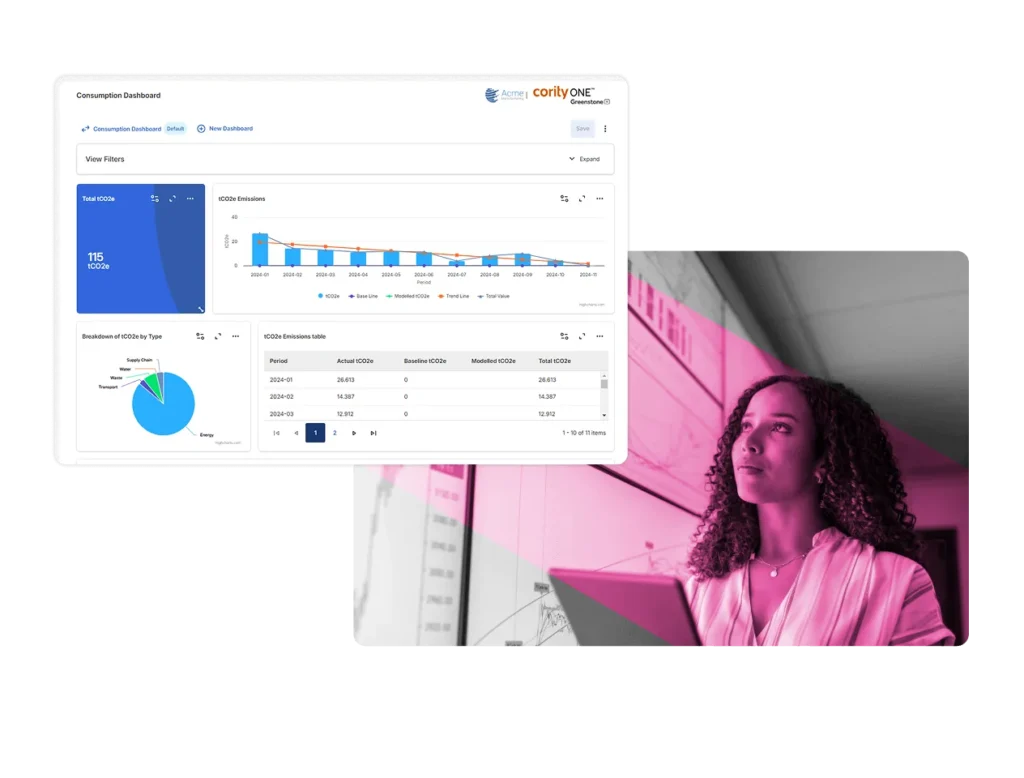
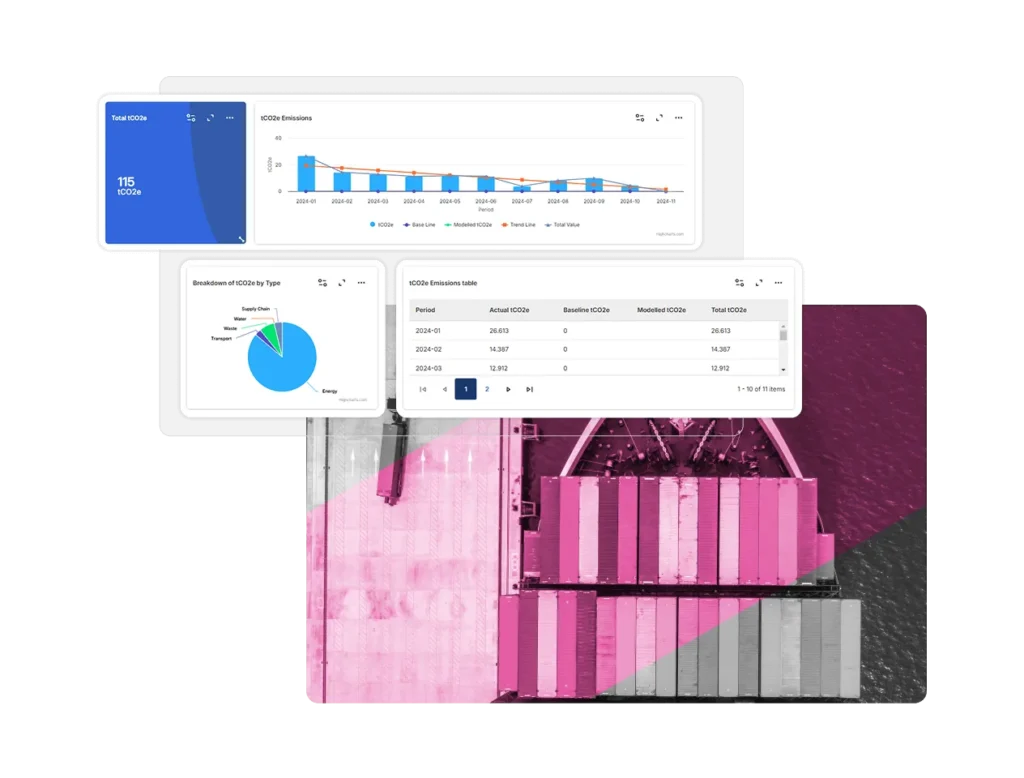
Precise Emissions Tracking
Calculate and manage financed emissions to meet reporting standards and climate goals.
EHS+ Solutions for Corporate Enterprises
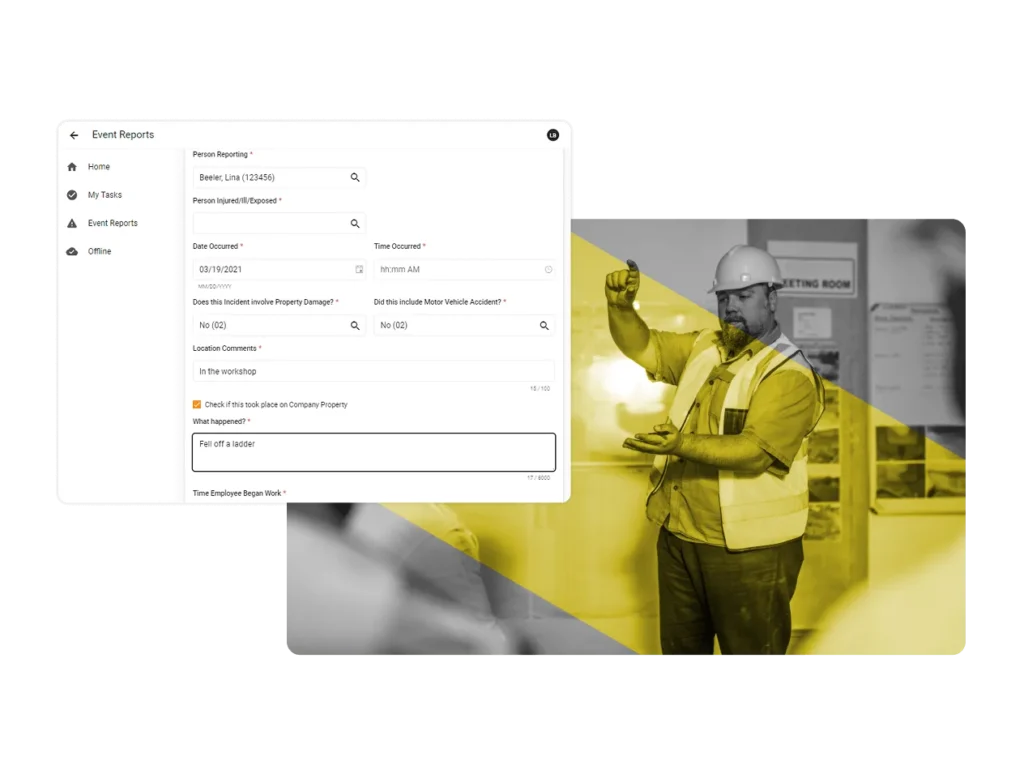
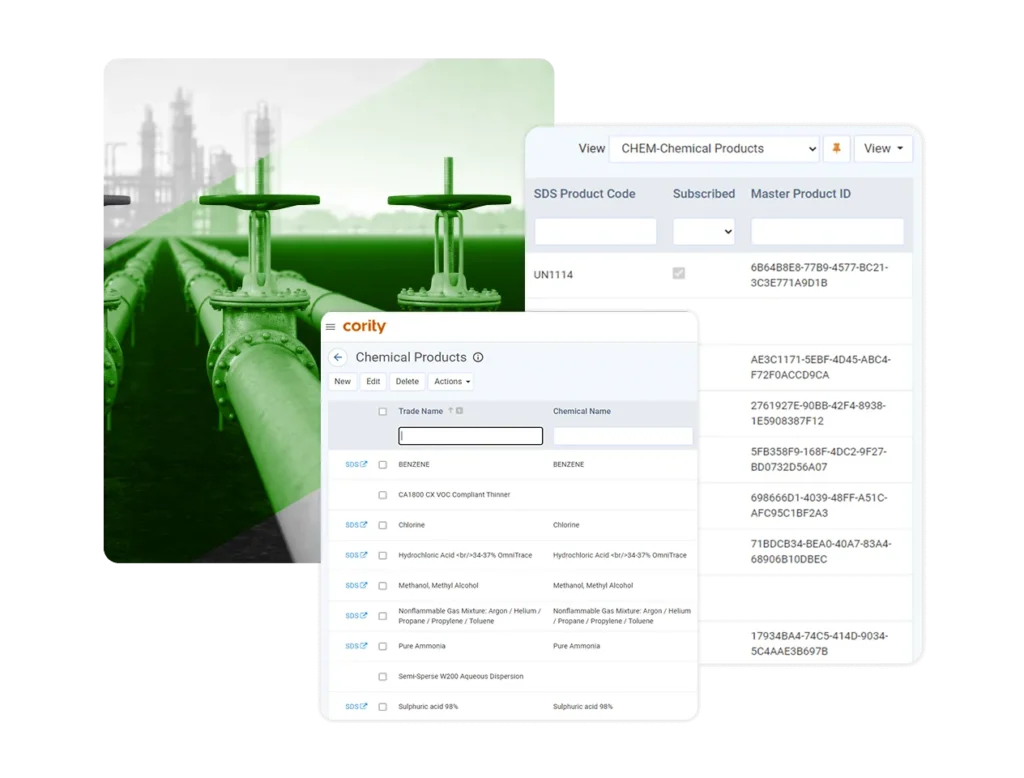
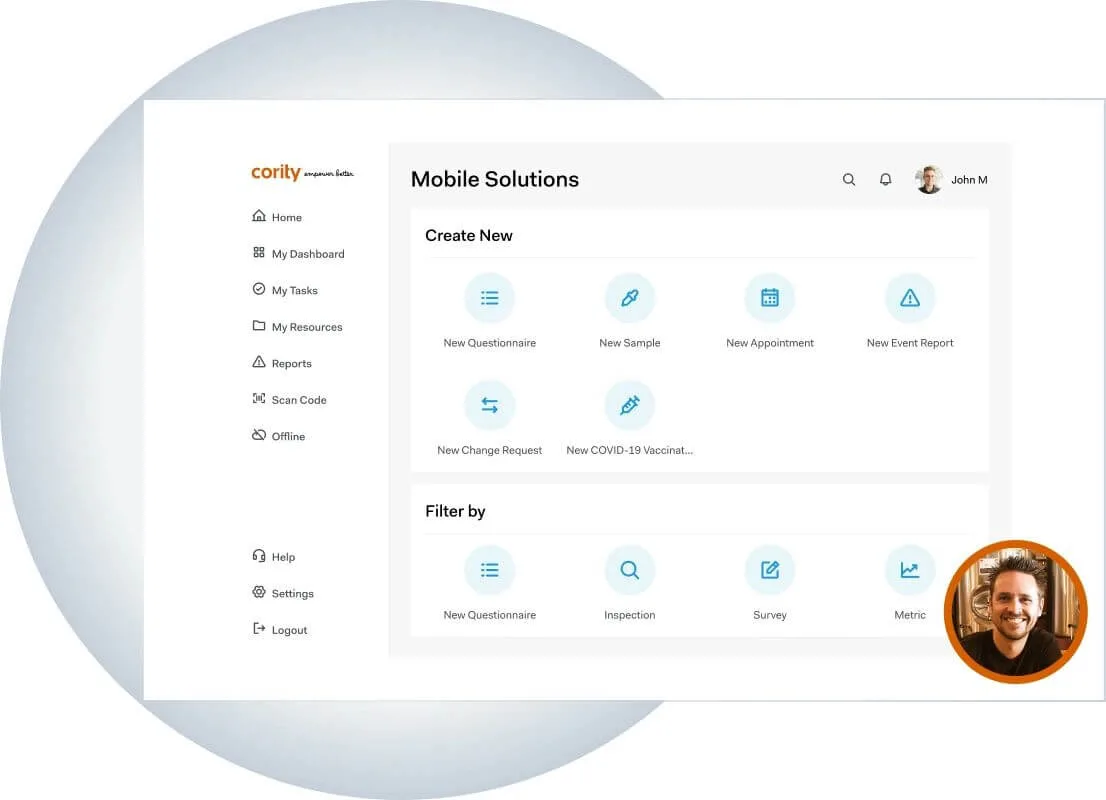
Incident Management
Capture events from across EHS and Sustainability in a unified workflow.
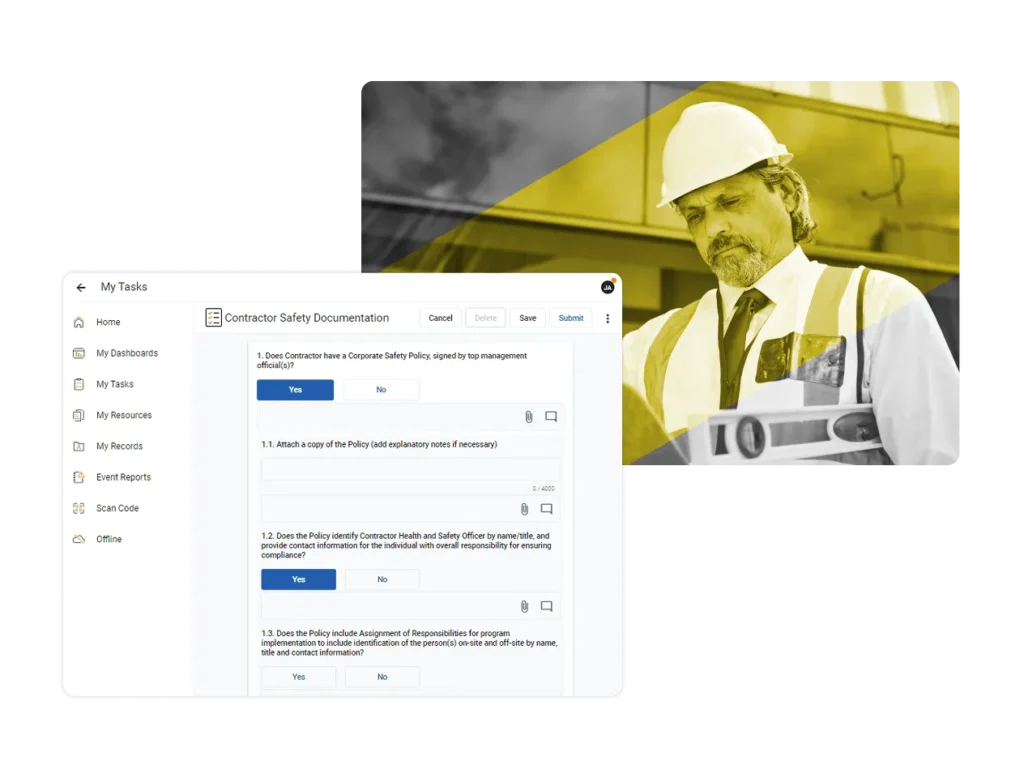
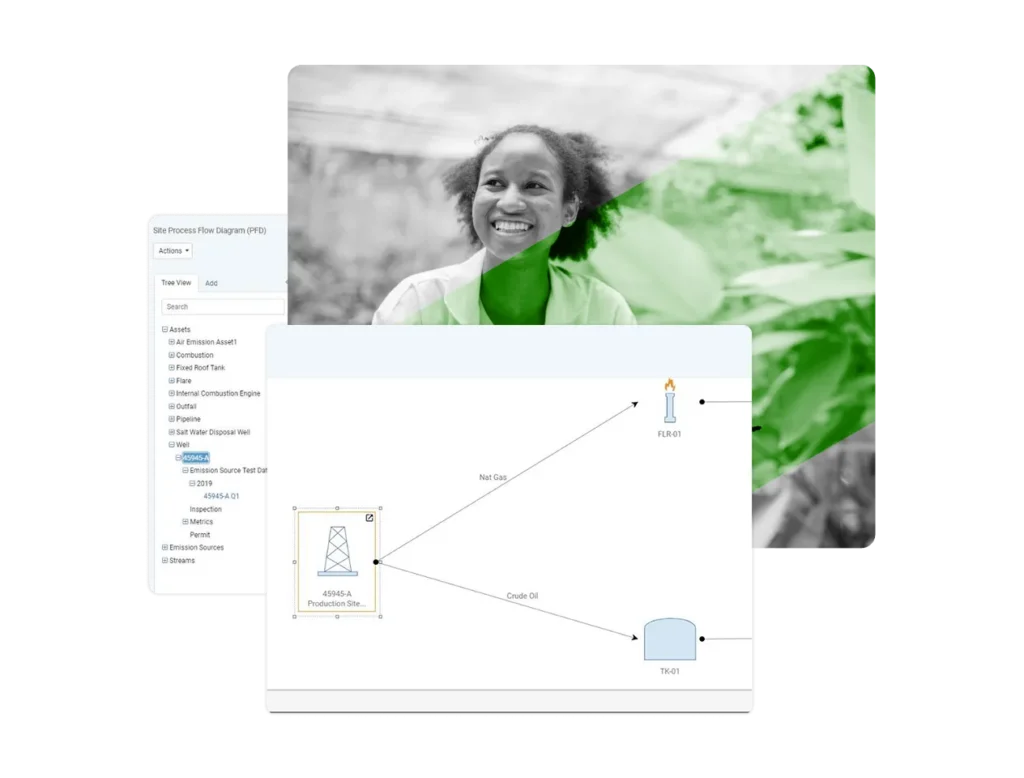
Corrective Actions
Assign tasks and track improvements across programs, removing data silos.
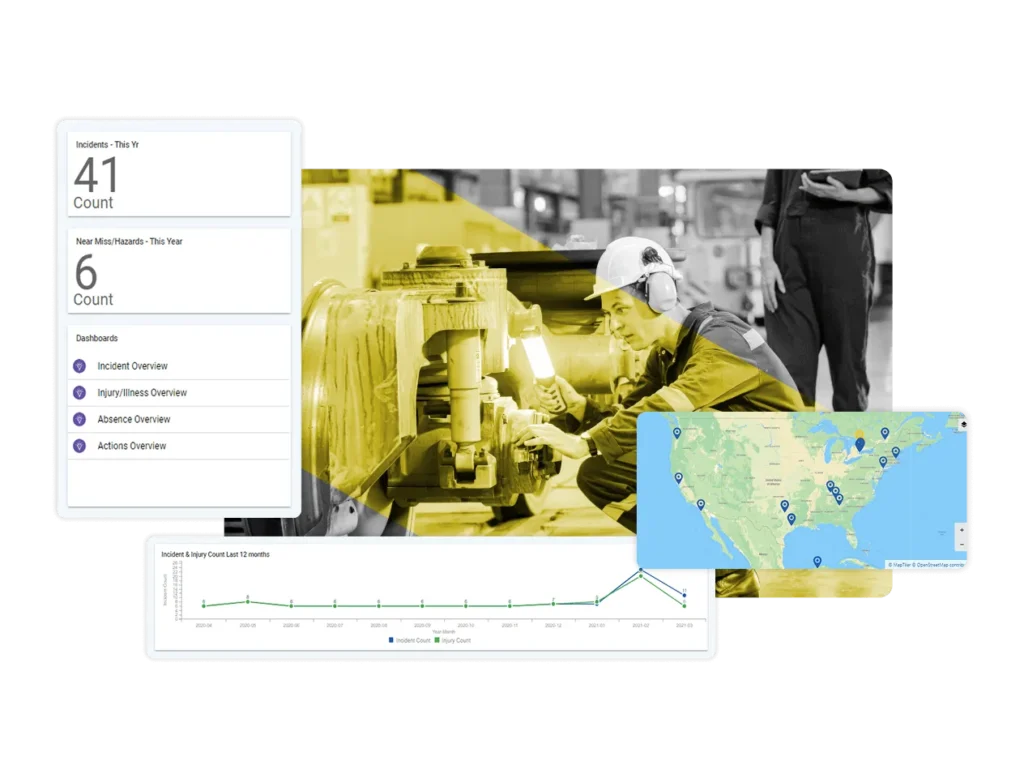
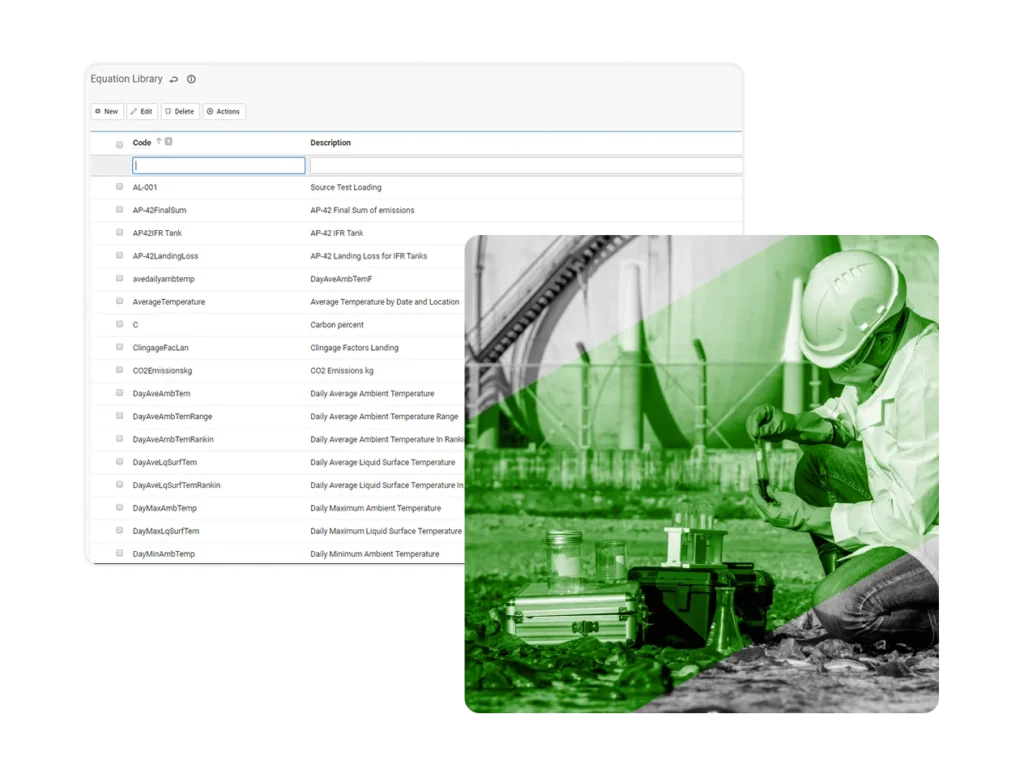
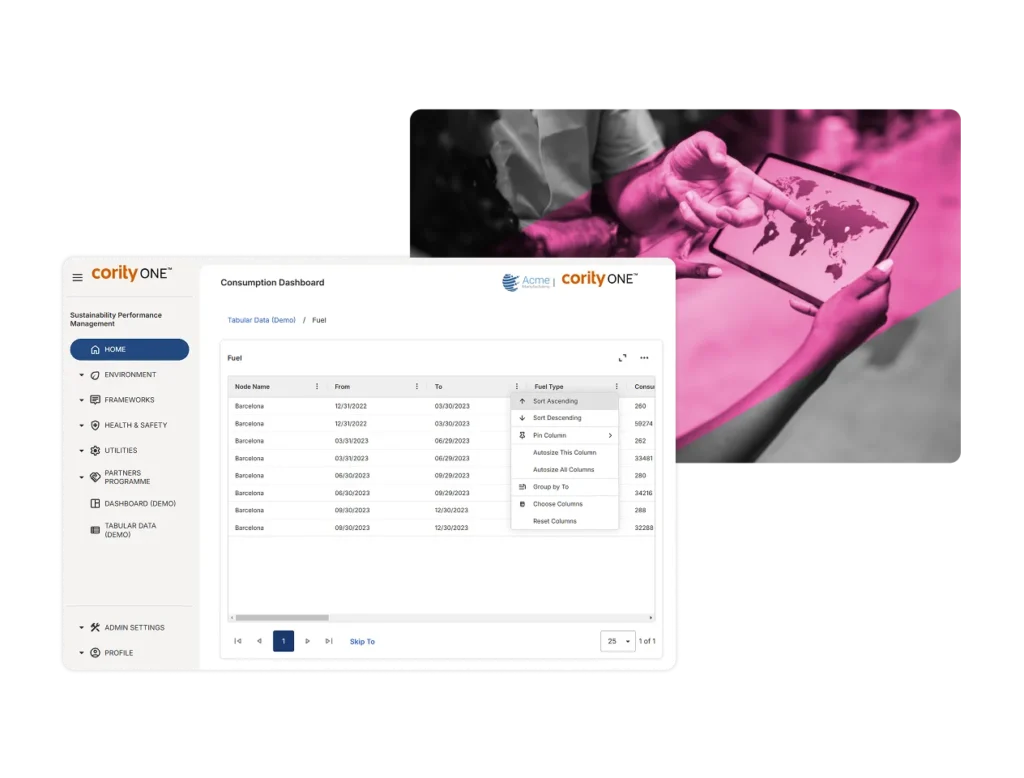
Air & Water Monitoring
Collect and manage data from multiple portfolio companies and fund structures using customizable questionnaires and GHG emissions calculation tools.
Integrated ESG Insights, Proven Value
225
Private market firms trust Cority to manage ESG data across investments.
$17T
Assets under management analyzed with integrated ESG metrics.
15+
Years helping investors turn ESG risk into measurable advantage.
4.3
Award‑Winning ESG Data Solutions for Investors
See the Full ESG Picture Across Your Portfolio
Integrate ESG and operational data to meet investor expectations, reduce risk, and build long‑term portfolio value.
Resources
Upcoming Webinars
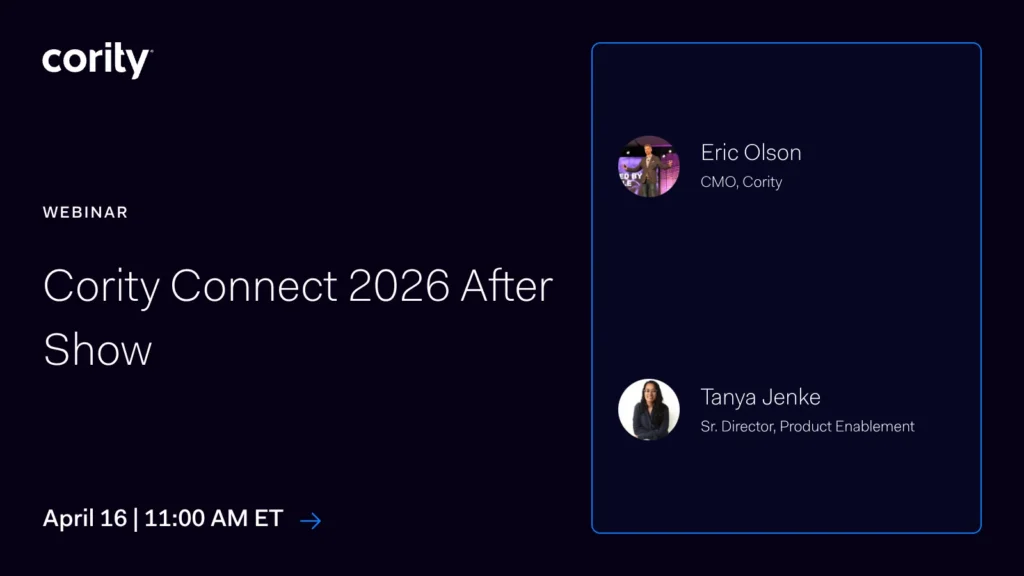
Cority Connect 2026 After Show
Upcoming Webinars
Join us on April 16th at 11am ET for the Cority Connect After Show — a live, hosted virtual event featuring the most important moments from one of the biggest EHS+ gatherings of the year. Cority CMO – Eric Olson and Senior Director of Product
Events
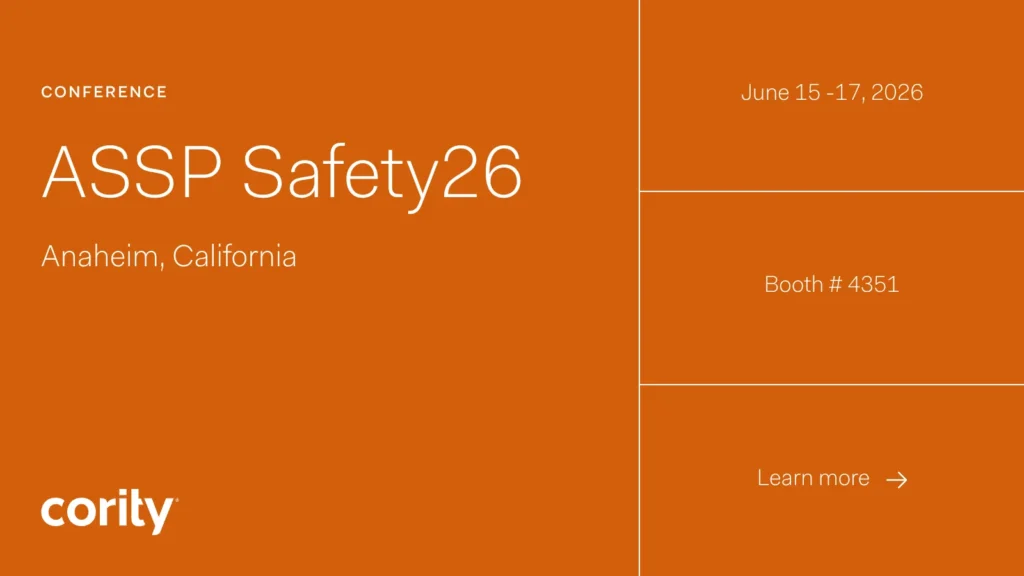
Safety 26 Conference & Expo
Events
Cority is excited to participate in the ASSP Safety Conference 2026, a leading event that brings together safety professionals to share insights, innovations, and strategies for advancing workplace safety worldwide. Come visit us at booth # 4351, where we will showcase how our powerful EHS
Events
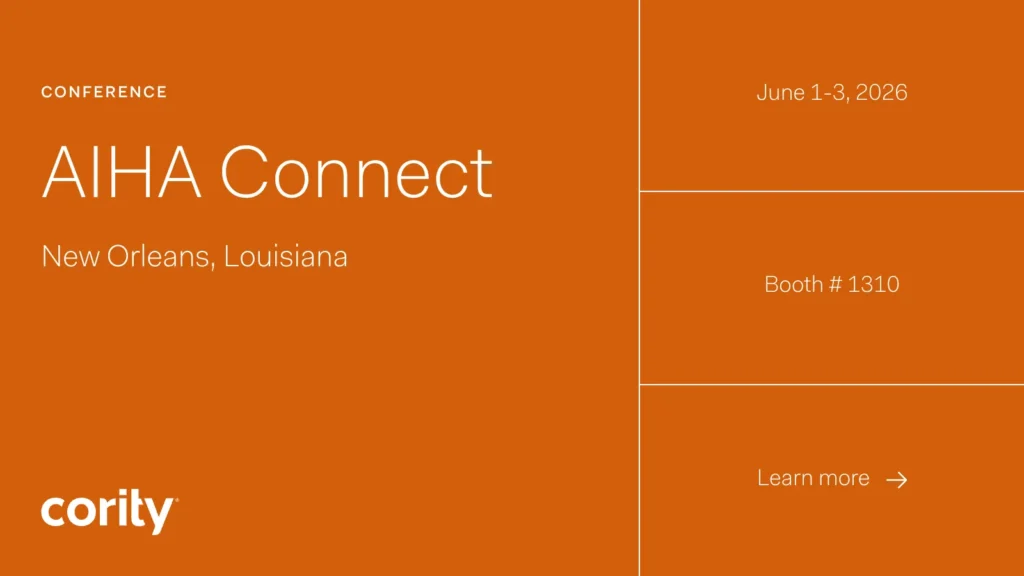
AIHA Connect 2026
Events
Cority is excited to attend AIHA Connect 2026, the American Industrial Hygiene Association’s premier conference and expo taking place June 1–3 in New Orleans, Louisiana. The event brings together industry experts, practitioners, and innovators to explore the latest trends, technologies, and best practices that advance
Events
American Occupational Health Conference
Events
Cority is proud to sponsor and attend the American Occupational Health Conference (AOHC) 2026, the premier gathering for occupational and environmental health professionals taking place April 19–22 in Chicago, Illinois. AOHC brings together experts and practitioners from around the world to share knowledge, explore best
Events
NAEM Opex-Tech 2026
Events
Cority is pleased to sponsor and attend NAEM OPEX & Tech 2026, a leading forum for EHS, sustainability, and operations leaders focused on advancing performance through technology and innovation. As part of the event, Executive Vice President, Product Strategy, Amanda Smith will join other industry
Events
AOHP Region 5 Conference
Events
Cority is pleased to sponsor and attend the AOHP Region 5 2026 Conference, connecting with occupational health professionals to discuss best practices and emerging trends in workplace health and safety. At the event, Julianna Gemme from the Cority Product team will show how our integrated