


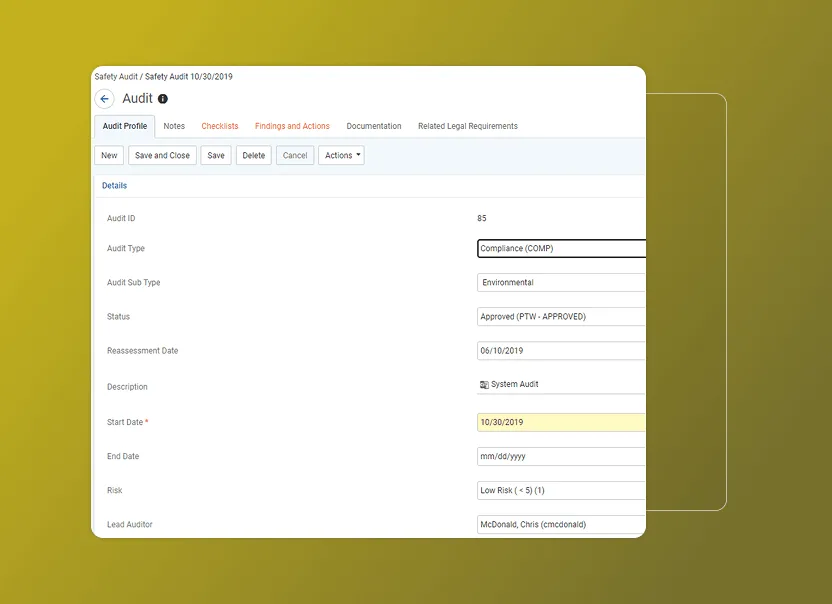
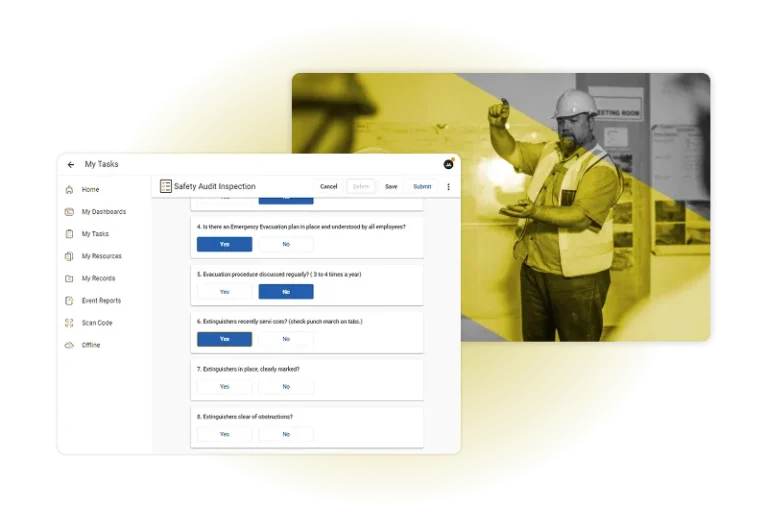
Improve audit reliability
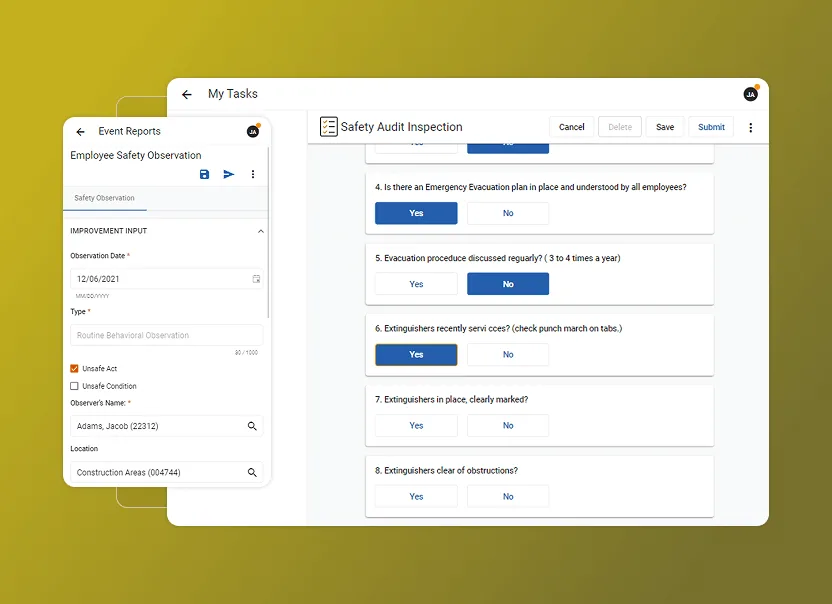
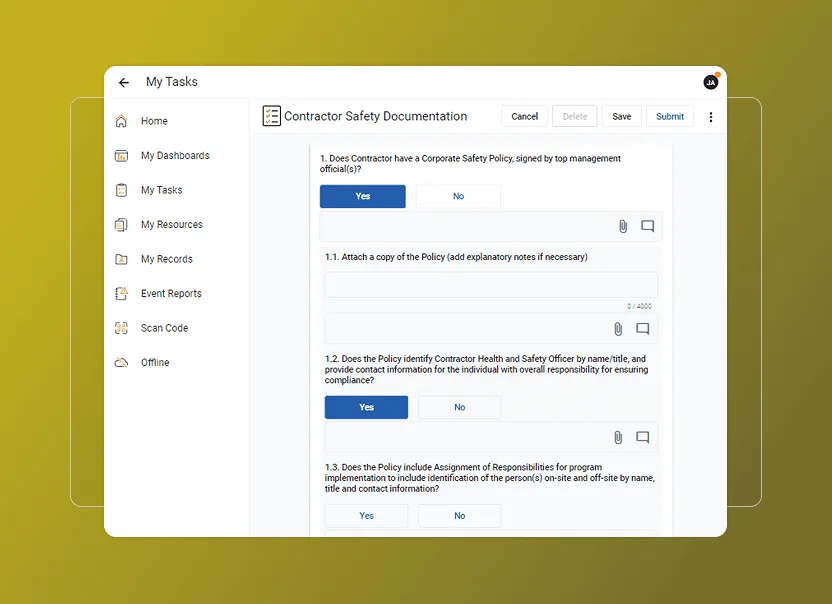
Mobile inspections
Automated scheduling

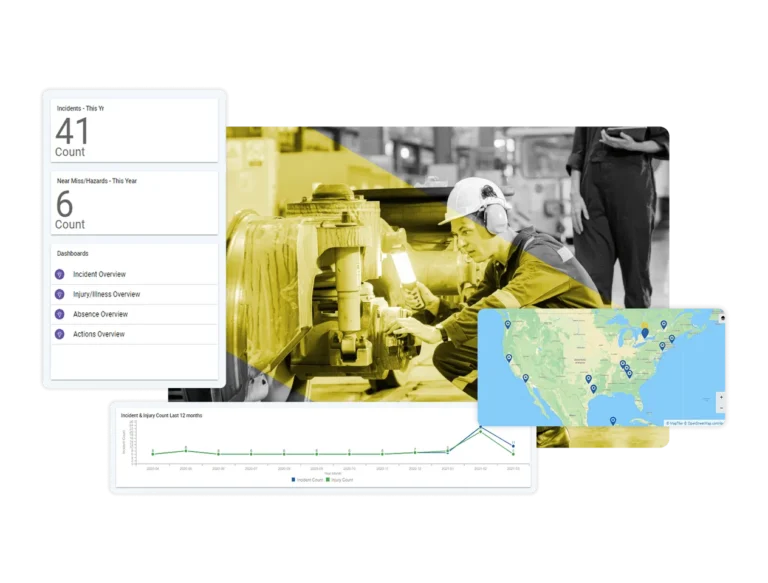
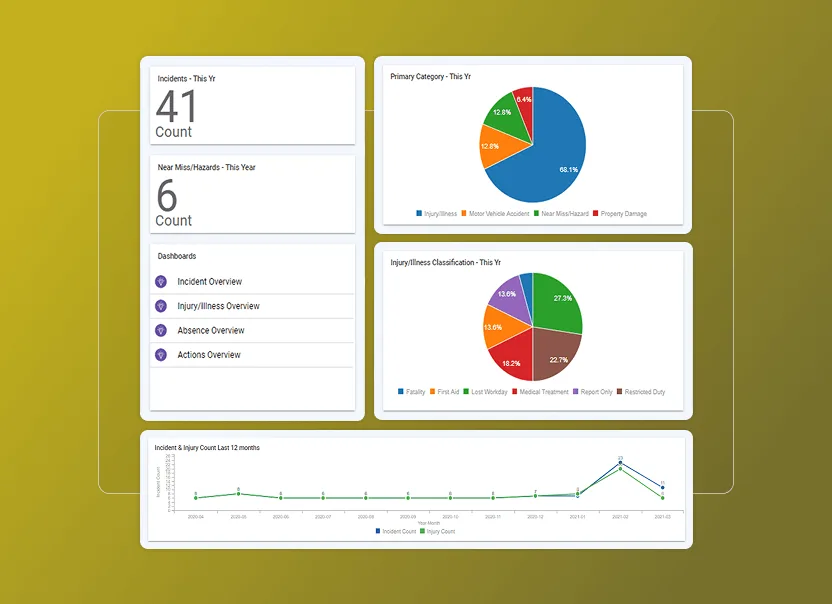
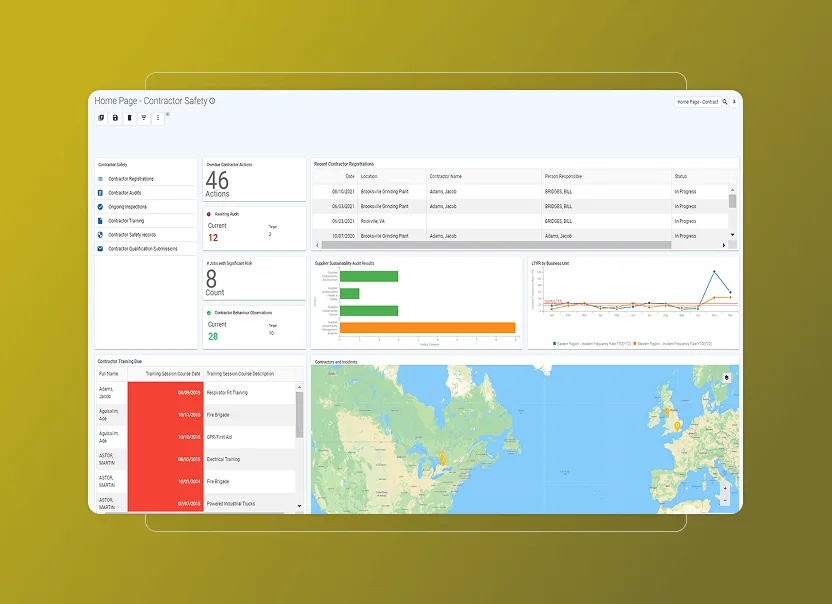
Insightful analytics
Manage contractor risk
Prequalification tools
Onsite compliance

Performance reviews
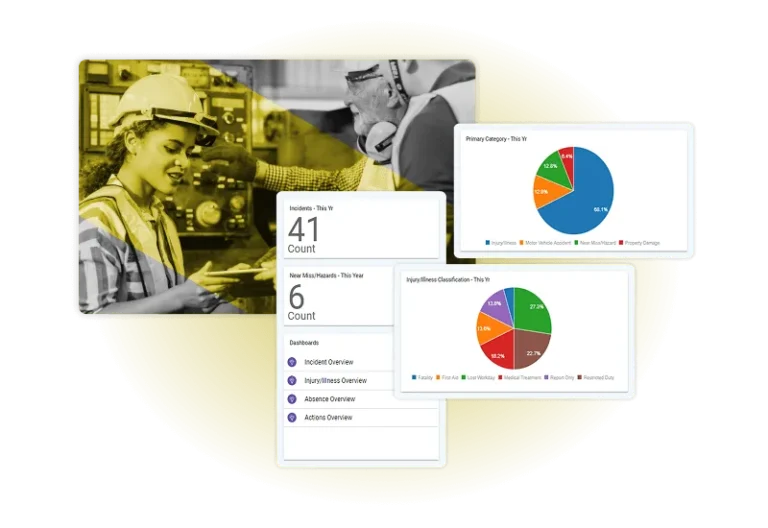
Standardize incident reporting
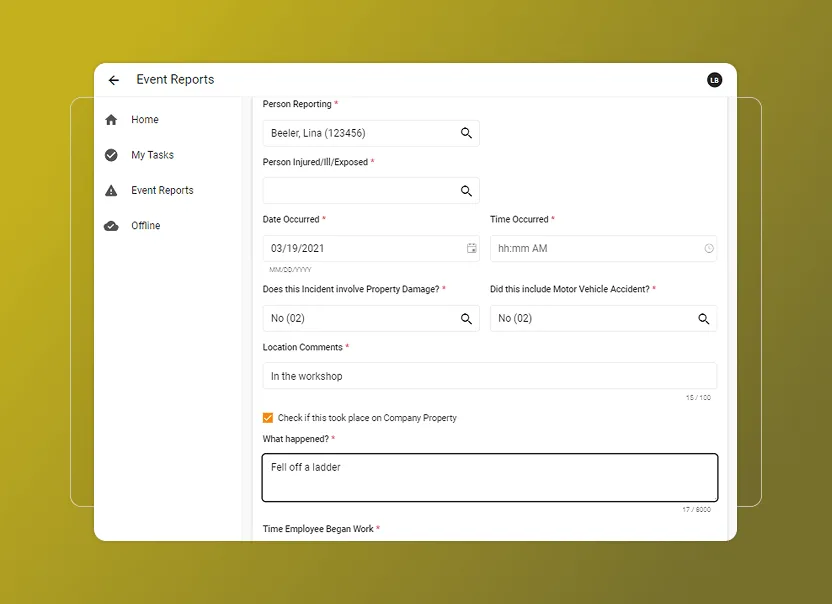
Root cause analysis

Action tracking
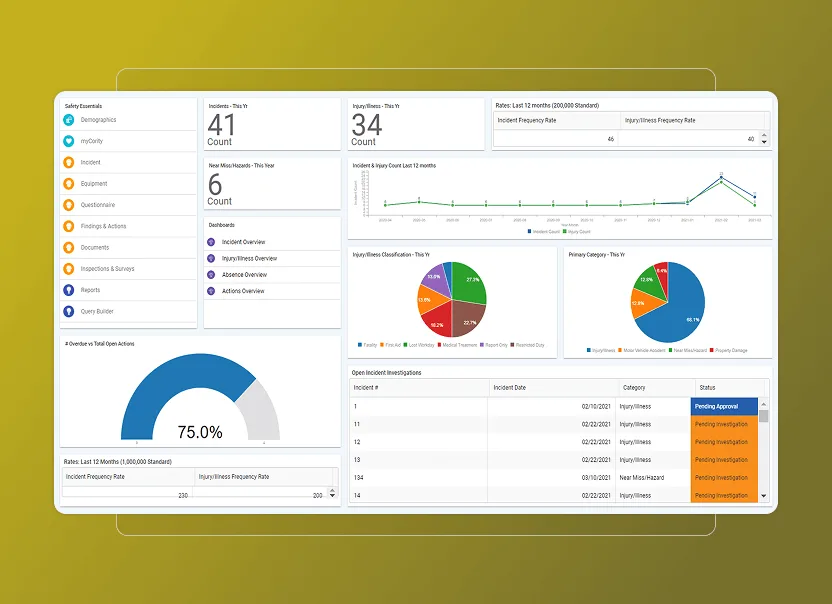
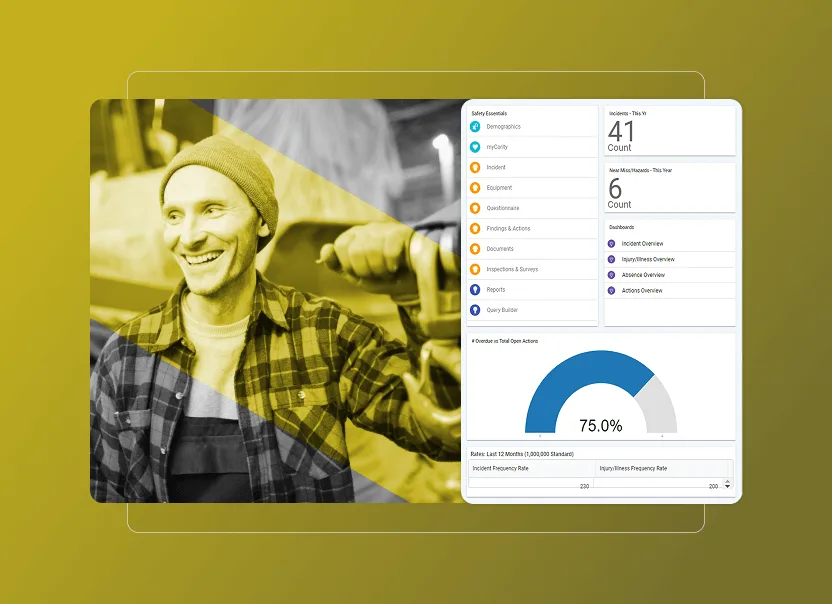
Real-time dashboards
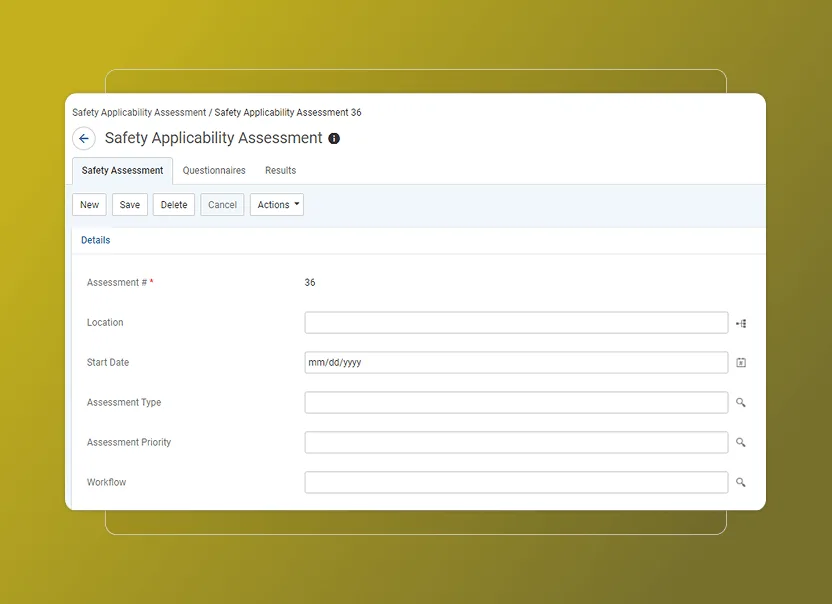
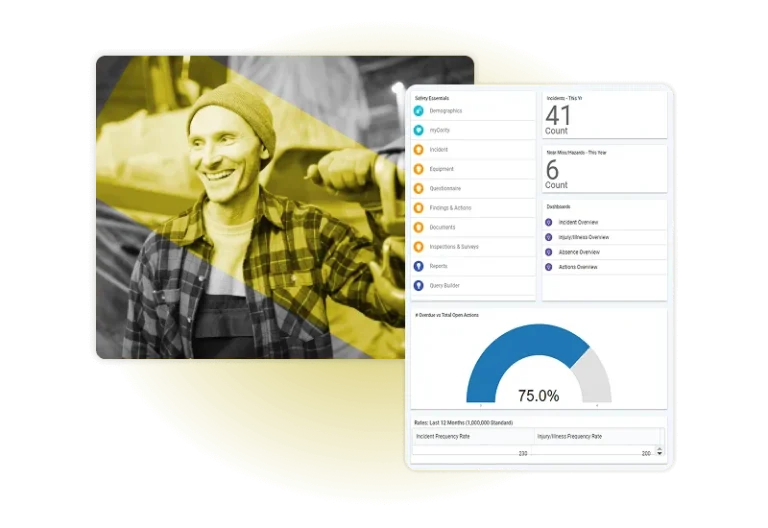
Assess and control risks
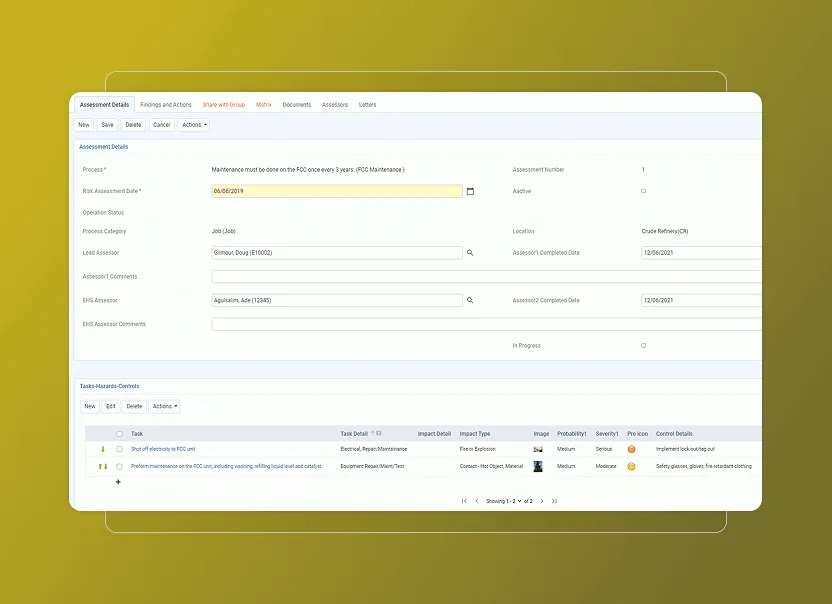
Centralized risk library
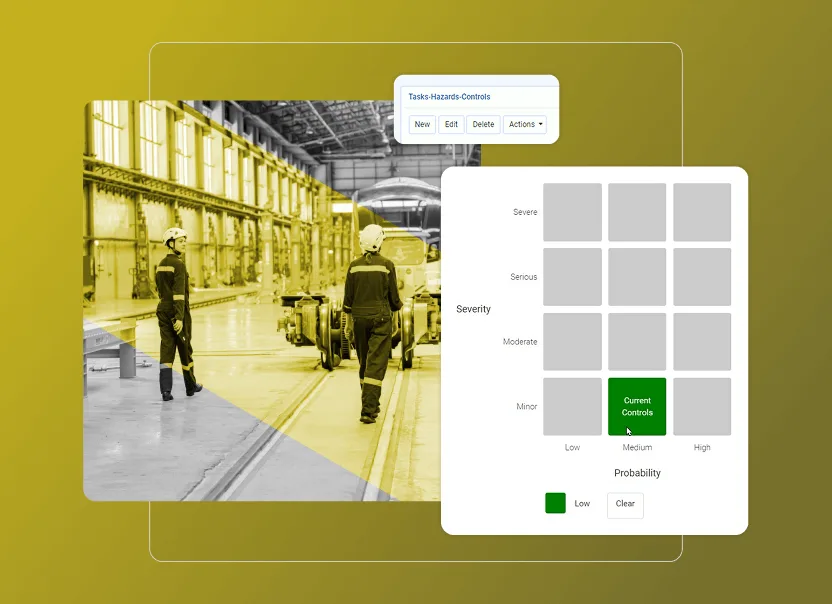
Dynamic workflows

Integrated reporting
Control high-risk work

Centralized permits
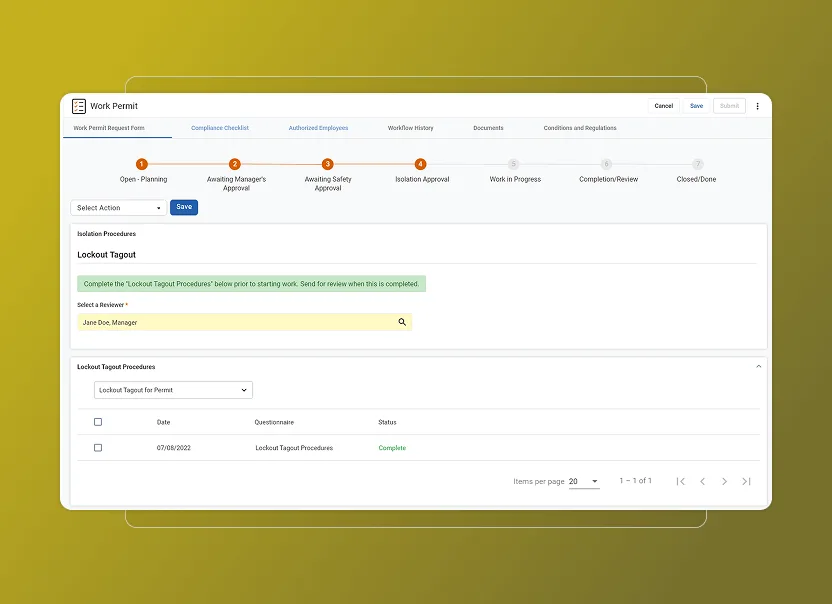
Integrated approvals

Compliance tracking


Cority Launches in Saudi Arabia to Support Safer, Smarter Operations Aligned with Vision 2030
Trusted AI-powered EHS solutions help organizations manage risk, protect workers, and meet rising regulatory demands across the Kingdom Toronto, ON

Cority Launches Advanced Motion Capture Solution to Strengthen Industrial Ergonomics Programs
Empowering organizations to proactively identify and reduce ergonomic risks with AI-powered technology [Toronto, ON – April 30, 2025] – Cority, the

Faces of EHS: William Palmer on the Value of Safety Tech
William Palmer is an experienced EHS leader and product marketing manager at Cority, an enterprise EHS and sustainability software provider.


